Community Forums › Forums › Prop Firms › FTMO v5.0 True Performance
- This topic has 5 replies, 3 voices, and was last updated 2 years, 8 months ago by
alexdergrosse_88.
-
AuthorPosts
-
Alan Northam
ParticipantThe following is the true performance over the last 5 trading days. With v5.0 you cannot determine the true performance over a given time frame by comparing the profit or loss of each robot in a demo account. The reason for this is that the SL is not the same for each robot and therefore the lot size for each robot is different if you equate each robot with the same risk. To determine the true performance for these robots I have used EA Studio.
Performance last 5 days
—————————-
XAUUSD 4.55%
USDCHF 0.68%
AUDCHF 0.66%
AUDUSD 0.50%
USDCAD 0.15%
EURAUD 0.00%
GBPAUD -0.04%
EURUSD -0.67%Performance last 30 days
——————————
USDCHF 2.50%
AUDUSD 1.31%
GBPAUD 1.07%
XAUUSD 0.96%
EURAUD 0.57%
USDCAD -0.30%
EURUSD -0.63%
AUDCHF -1.19%Alan,
Marin Stoyanov
KeymasterI use https://www.cashbackforex.com/tools/position-size-calculator to correctly calculate a position size for 1% risk per trade given the SL in pips that each of the v5.0 robots are using.
Thanks for the results Alan.
ParticipantI use a calculator as well :o)
Alan,
alexdergrosse_88
ParticipantHello, the lot sizes are imported via the set files. There is a fixed calculation for each pair. I don’t need to calculate anything myself for this version (V5.0). So my account runs in the default settings.
The FTMO account has been running since 10.11.23. Here are my figures……
Let’s see if it runs better in the coming week….Participant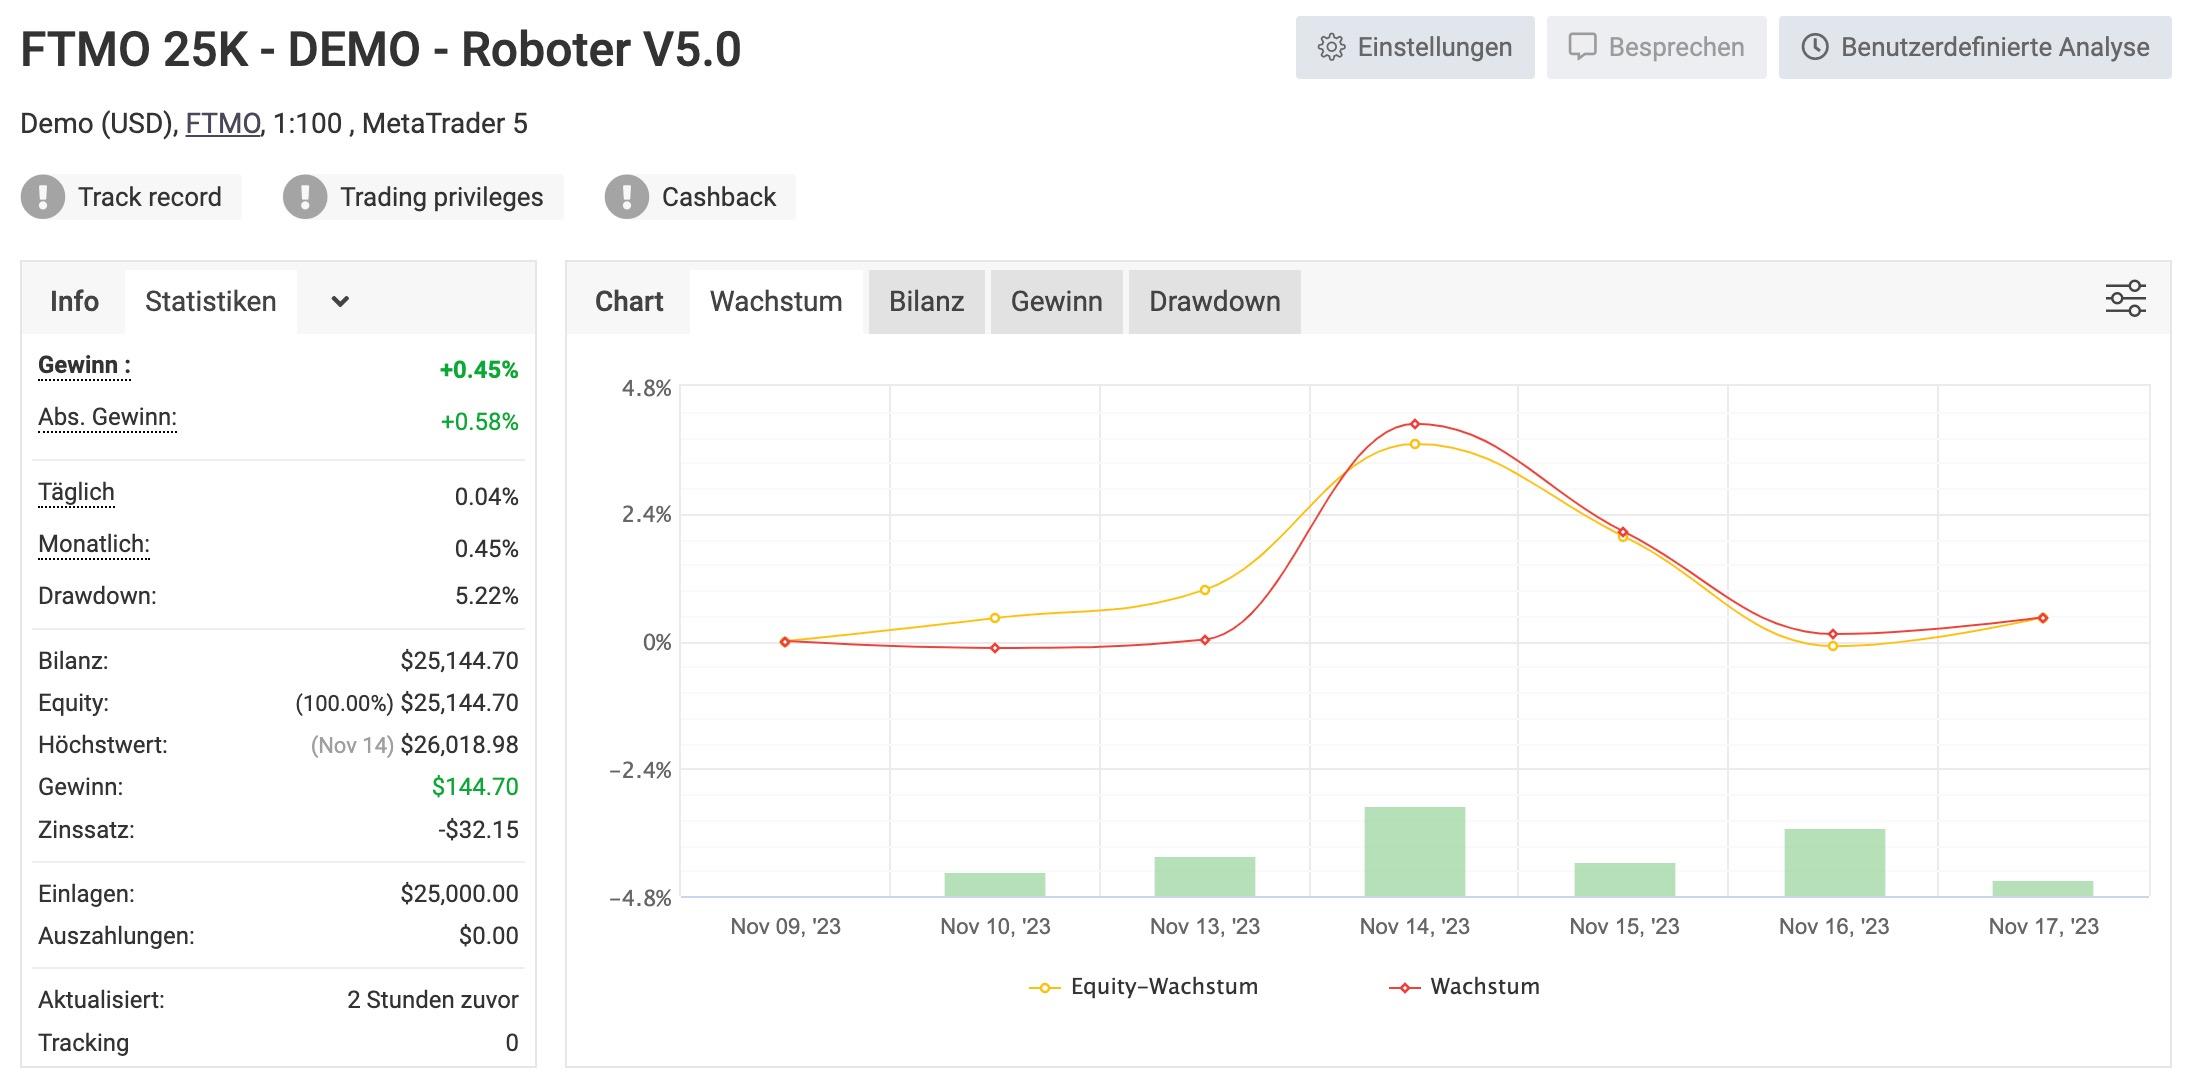 Participant
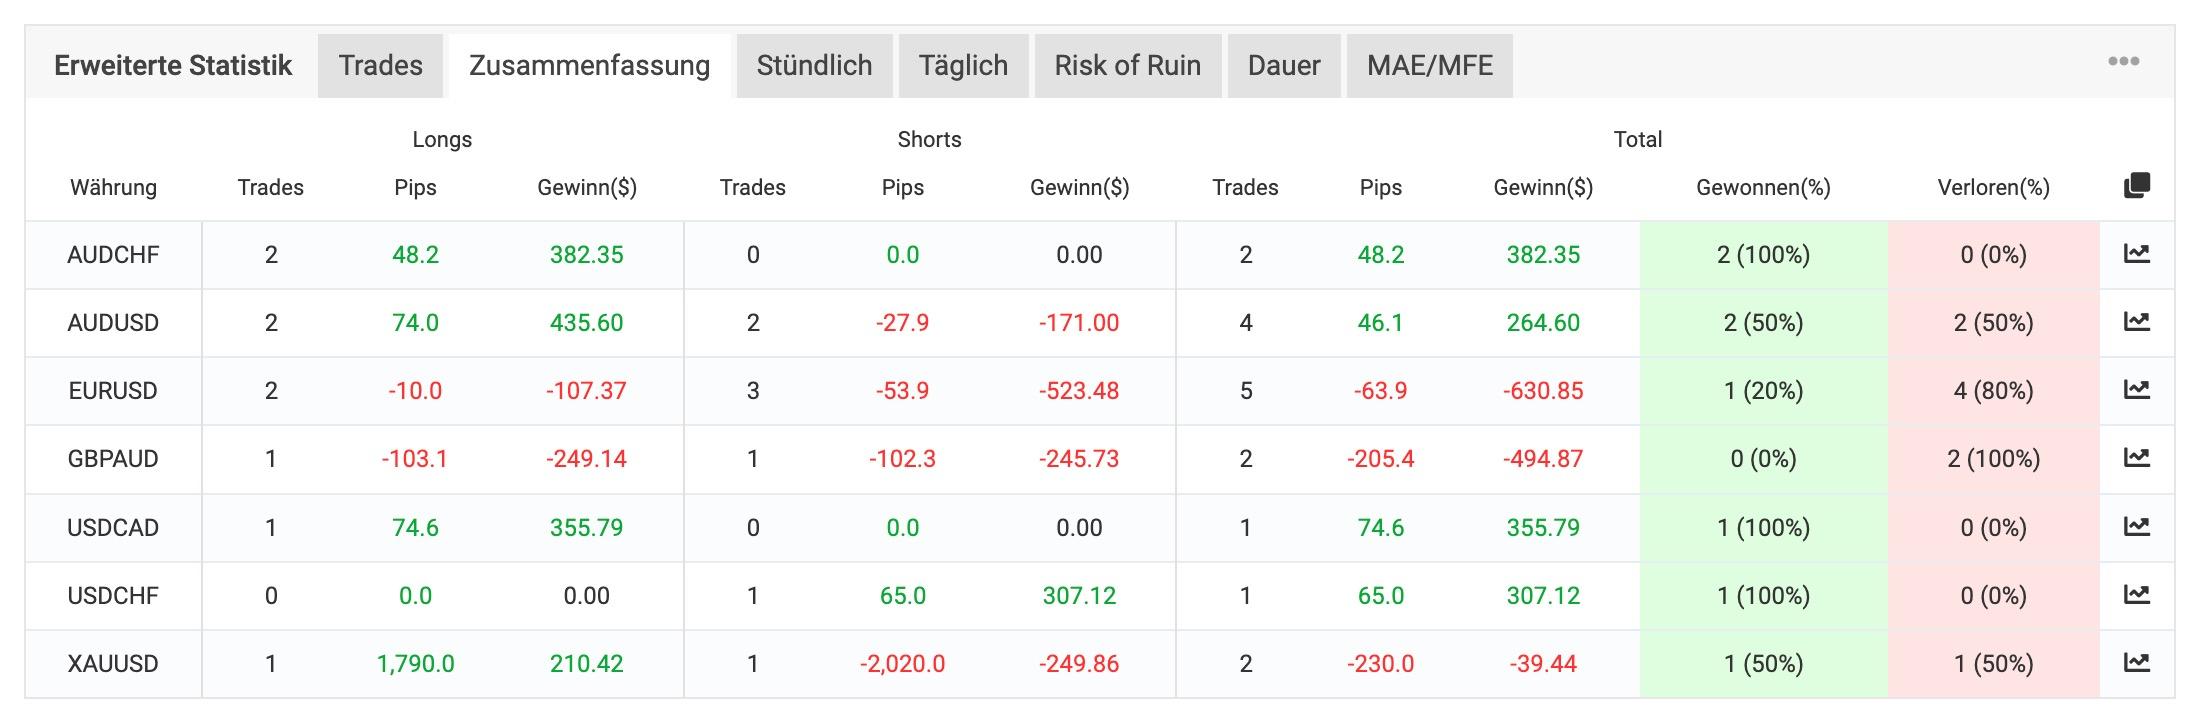
-
AuthorPosts