Community Forums › Forums › EA Studio › EA Studio Tools and Settings › EA Studio Tools and Settings: Experience and Results
Tagged: #acceptance criteria, EA Studio, FTMO-Data
- This topic has 286 replies, 38 voices, and was last updated 1 year, 6 months ago by
Alan Northam.
-
AuthorPosts
-
June 6, 2024 at 8:08 pm #260010
WassB
ParticipantHello,
Does anyone know why FTMO-Data has disappeared from EA studio ?
I’m working a lot with those data and now I’m stuck, even when I load on EA studio interface, the FTMO-data I got using the express generator, It doesnt work. I can’t do Walkforward or else…
Is it temporary ?
Thank you,
WassB
June 11, 2024 at 10:57 pm #260794ParticipantMaybe Petko you have informations about the question above ? or can you get information from the developper please ?
Thank you,
Regards,
WassB
June 18, 2024 at 12:41 am #261721ParticipantHello ?
Is this forum dead ?
June 18, 2024 at 8:06 am #261745NIKOS KYRIAKOU
MemberHey WassB,
Sorry for the late reply.
So, after the experience we had with FTMO, we decided to remove the data from EA Studio.
Kind Regards,
NikosAugust 22, 2024 at 8:31 pm #302151Ricky Suen
ParticipantHello, all. I am a new comer to the EA Studio. I have experimented a lot with the software but cannot find any consistantly profitable strategies. To find the strategies for a past month, I use the historical data of n months before that month. Although the strategies are profitable for the n months, when I apply them to the target month, they become losing. I tried a lot of symbols, time frames, acceptance criteria, robustness testing but the result is the same. May I know if anyone here can generate strategies which are consistantly profitable? What is your setting? Have you performed the same testing as mine?
August 23, 2024 at 12:23 pm #302222Alan Northam
ParticipantHi Ricky,
In Generator use Out of Sample Testing. Historical data set for last one year including the current date. In the Acceptance Criteria make the out of sample and in sample white fields to have a profit factor of 1.2. This should get you going in the right direction.
Alan,
August 23, 2024 at 6:00 pm #302271ParticipantI think your method only means that you split the historical data into two sets and perform backtest on each of them. You assume that if these two sets pass the backtests, it will perform well in the future.
I want to use the historical data to prove if it is true. My method is: (1) Set data horizon to 1/6/2023 to 30/9/2023 (4 months); (2) Generate the strategies using EA Studio; (3) Add the top 5 strategies to the portfolio; (4) Change the data horizon to 1/10/2023 to 31/10/2023 (next month); (5) Recalculate the portfolio; (6) Advance the data horizons by one month and repeat the process ten times.
Since all strategies generated in step (2) are profitable, I expect that the result from (5) (i.e. next month after the sample data) is also profitable on average. However, the result is very disappointing. The average is losing. It means that if I used the generated strategies in the past, I would be losing money.
May I know if my testing is meaningful? Why the result is negative? Has anybody tried to perform similar tests and got positive results?
August 23, 2024 at 7:59 pm #302285ParticipantNo! If you set the historical data to 1/6/2023 to 30/10/2023 and select OOS equal to 40% it will use the 1/6/2023 to 30/9/2023 (the sample historical data) to find strategies with profit factor of 1.2 or greater. It will then take these strategies and trade them from 30/9/2023 to 30/10/2023 (the out of sample historical data time period/the next month). The strategies with profit factor of 1.2 or greater in the out of sample time frame will show profitable traded strategies during the next month. When you look at the strategies in the Collection tab the green area is the performance of the traded strategies over the next month (from 30/9/2023 to 30/10/2023). You can then add the best ones to the portfolio.
Alan,
August 23, 2024 at 9:22 pm #302311ParticipantThanks for your prompt reply, Alan. I think I need to use an example to show my idea. Let me set up a reactor with the data horizon of 1/6/2023 – 31/10/2023, OOS = 40%, min. profit factor = 1.2. After execution, 23 strategies are collected.
Then I add the top 5 strategies to the portfolio and check the result. The net profit is 1233.18 which is normal.
To check how the strategies perform in the next month, I changed the data horizon to 1/11/2023 – 30/11/2023 and click the “Calculate” button in the portfolio page. The net profit became -39.82. It means that the generated strategies is losing in the next month.
I checked many symbols, time frames and data horizon, the negative profit is more common than the positive. So it means that I cannot rely on the strategies generated from previous months. Is this conclusion correct or I am doing something wrong?
August 23, 2024 at 9:49 pm #302312ParticipantLet me run the reactor. Is your dates from June 1, 2023 through October 31, 2023? If so then OOS of 20% would be one month not 40%. Sorry if I gave you the wrong OOS percentage number earlier. I will now run the reactor with these numbers.
Alan,
August 23, 2024 at 9:52 pm #302313ParticipantYes
August 23, 2024 at 9:57 pm #302315ParticipantGreat! I am now running the reactor without Monte Carlo so strategies will be generated faster for testing purposes. I will run the reactor for 3 minutes to collect strategies.
Alan,
August 23, 2024 at 10:03 pm #302316Participant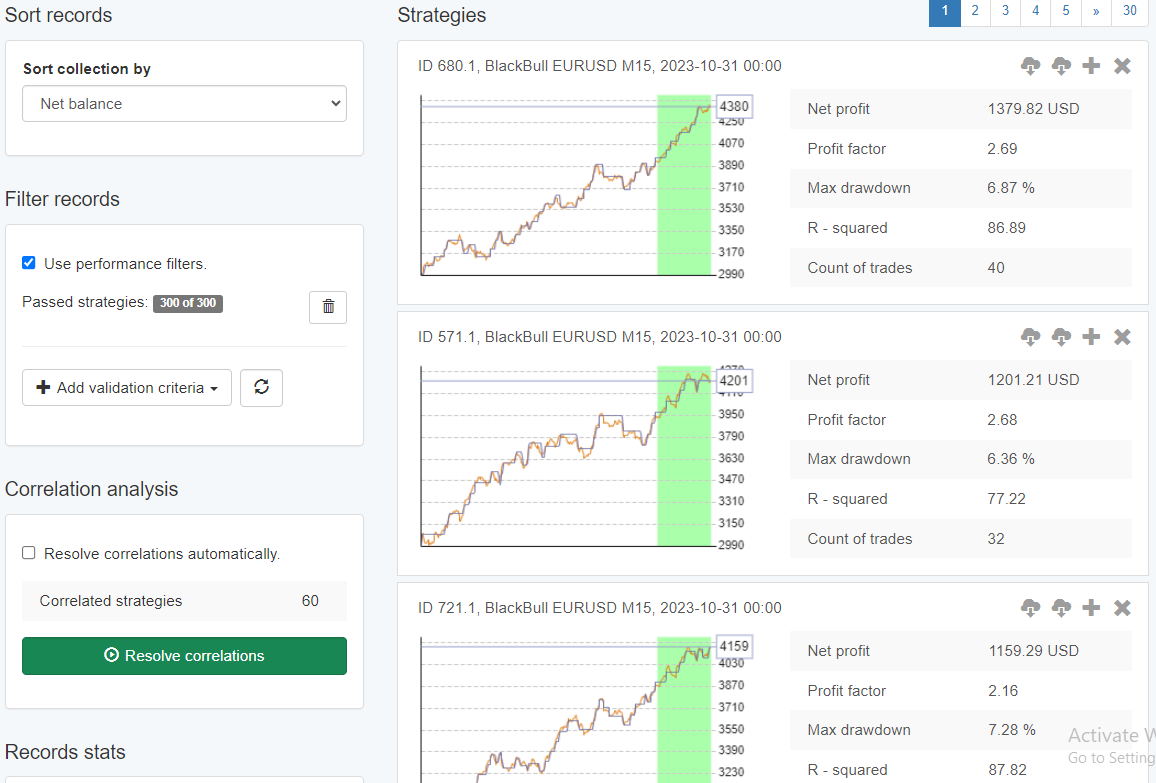 August 24, 2024 at 12:15 am #302340Participant
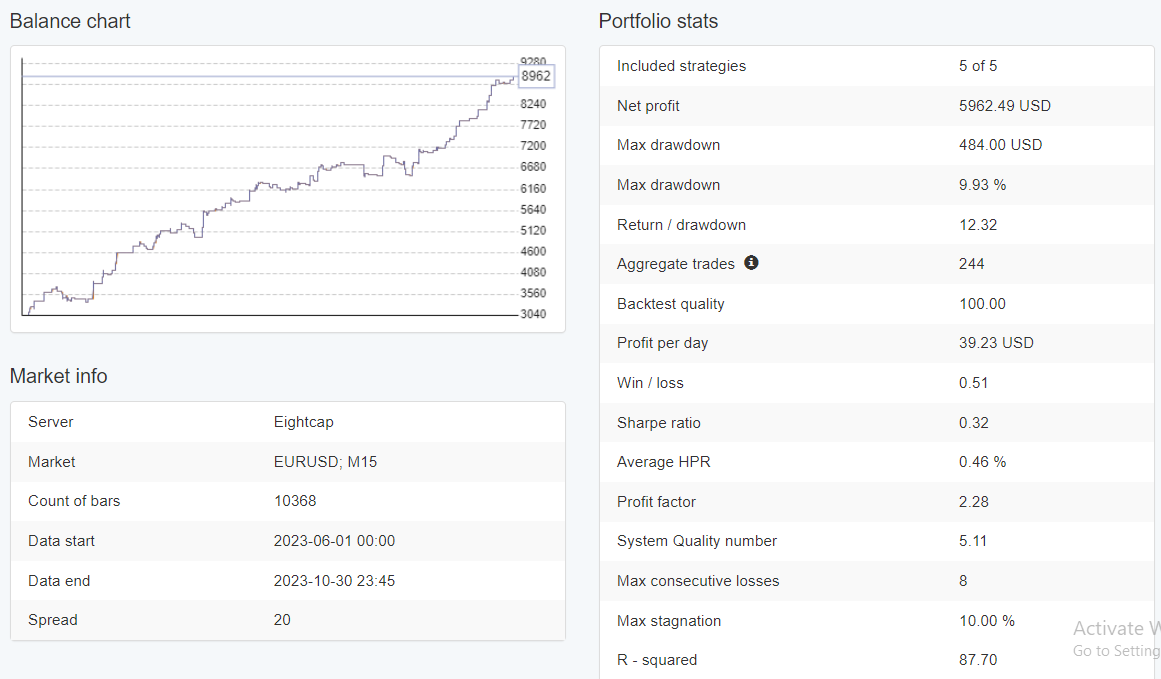
I then added the top 5 to a portfolio. The last 30 days of the balance line is the out of sample part or as you call it “the last month”.
 August 24, 2024 at 12:20 am #302341Participant
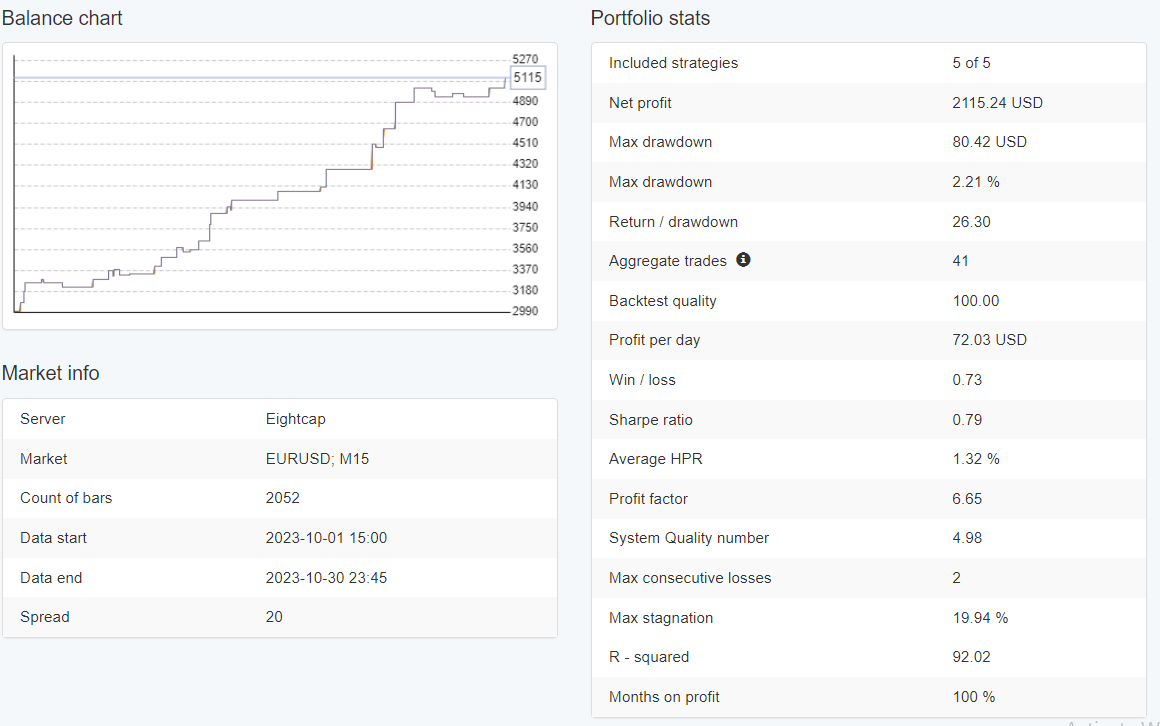
Now I want to see what the portfolio profit was for just the out of sample / the next month was so I change the data horizon from September 30, 2023 to October 31,2023.
-
AuthorPosts
- You must be logged in to reply to this topic.